Thresholds and interpolation
This example XML file is SE compliant. It uses interpolation to plot a reanalysis of sea surface temperature as a colour map and thresholds to plot the analysis error as degrees of blackening, also as a colour map.
<?xml version="1.0" encoding="ISO-8859-1"?>
<StyledLayerDescriptor version="1.1.0" xsi:schemaLocation="http://www.opengis.net/sld
StyledLayerDescriptor.xsd" xmlns="http://www.opengis.net/sld" xmlns:ogc="http://www.opengis.net/ogc" xmlns:se="http://www.opengis.net/se" xmlns:xlink="http://www.w3.org/1999/xlink" xmlns:xsi="http://www.w3.org/2001/XMLSchema-instance">
  <NamedLayer>
    <se:Name>OSTIA/analysed_sst</se:Name>
    <UserStyle>
      <se:Name>Interpolated red-blue colour map</se:Name>
      <se:CoverageStyle>
        <se:Rule>
          <se:RasterSymbolizer>
            <se:Opacity>1.0</se:Opacity>
            <se:ColorMap>
              <se:Interpolate fallbackValue="#00000000">
                <se:LookupValue>Rasterdata</se:LookupValue>
                <se:InterpolationPoint>
                  <se:Data>270.0</se:Data>
                  <se:Value>#FF4499CC</se:Value>
                </se:InterpolationPoint>
                <se:InterpolationPoint>
                  <se:Data>290.0</se:Data>
                  <se:Value>#FFFFFFFF</se:Value>
                </se:InterpolationPoint>
                <se:InterpolationPoint>
                  <se:Data>310.0</se:Data>
                  <se:Value>#FFDD6644</se:Value>
                </se:InterpolationPoint>
              </se:Interpolate>
            </se:ColorMap>
          </se:RasterSymbolizer>
        </se:Rule>
      </se:CoverageStyle>
    </UserStyle>
  </NamedLayer>
  <NamedLayer>
    <se:Name>OSTIA/analysis_error</se:Name>
    <UserStyle>
      <se:Name>Black bands of thresholded opacity</se:Name>
      <se:CoverageStyle>
        <se:Rule>
          <se:RasterSymbolizer>
            <se:Opacity>1.0</se:Opacity>
            <se:ColorMap>
              <se:Categorize fallbackValue="#00000000">
                <se:LookupValue>Rasterdata</se:LookupValue>
                <se:Value>#00000000</se:Value>
                <se:Threshold>0.5</se:Threshold>
                <se:Value>#33000000</se:Value>
                <se:Threshold>1.8</se:Threshold>
                <se:Value>#66000000</se:Value>
                <se:Threshold>2.2</se:Threshold>
                <se:Value>#99000000</se:Value>
                <se:Threshold>2.4</se:Threshold>
                <se:Value>#CC000000</se:Value>
                <se:Threshold>2.5</se:Threshold>
                <se:Value>#FF000000</se:Value>
              </se:Categorize>
            </se:ColorMap>
          </se:RasterSymbolizer>
        </se:Rule>
      </se:CoverageStyle>
    </UserStyle>
  </NamedLayer>
</StyledLayerDescriptor>
The resulting output image and its legend are shown below:

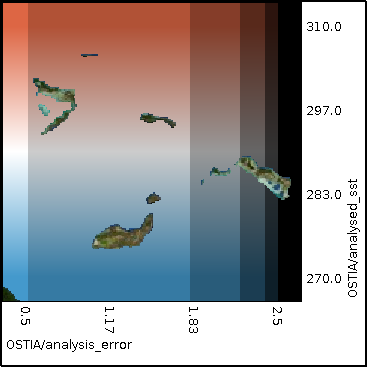
In this and all the legends that follow the topography is there to indicate regions where there is a degree of opacity. In this case it is where there is no data present for the SST over land.